In today’s technology-driven world, gaining deep insights into application performance and behavior is crucial to ensure seamless user experiences and efficient troubleshooting. A system that provides easy, deep access to the application, like the number of calls, user interaction between applications, time taken for the request to be served, etc., can help achieve this.
Microsoft’s Azure Application Insights stands out as a powerful solution. This blog post delves into the capabilities of Azure Application Insights and discusses how it can be integrated with the ASP.NET core applications.
What are Azure Application Insights?
Azure Application Insights is a cloud-based monitoring service that helps developers detect, diagnose, and resolve issues affecting their applications. It can provide real-time telemetry data about the application’s availability, performance, and usage patterns. With a range of features such as request tracking, dependency tracking, exception tracking, and custom metrics, Application Insights empowers developers to proactively identify and resolve performance bottlenecks and errors.
Let’s go step by step from web app service setup to exploring its main features.
Azure App Service Creation and Configuration of Azure Application Insights
To begin, follow these steps to create an Azure App Service:
Step 1: Log in to the Azure Portal (portal.azure.com).
Step 2: Click on "Create a resource" and search for "App Service" in the Azure Marketplace.
Step 3: Click on "App Service" and then "Create" to start the creation process.
Step 4: Provide the necessary details, such as the subscription, resource group, and unique app name.
Step 5: Choose the appropriate runtime stack, such as ASP.NET Core, .NET Framework.
Step 6: Fill in all the required information and navigate to the Monitoring tab.
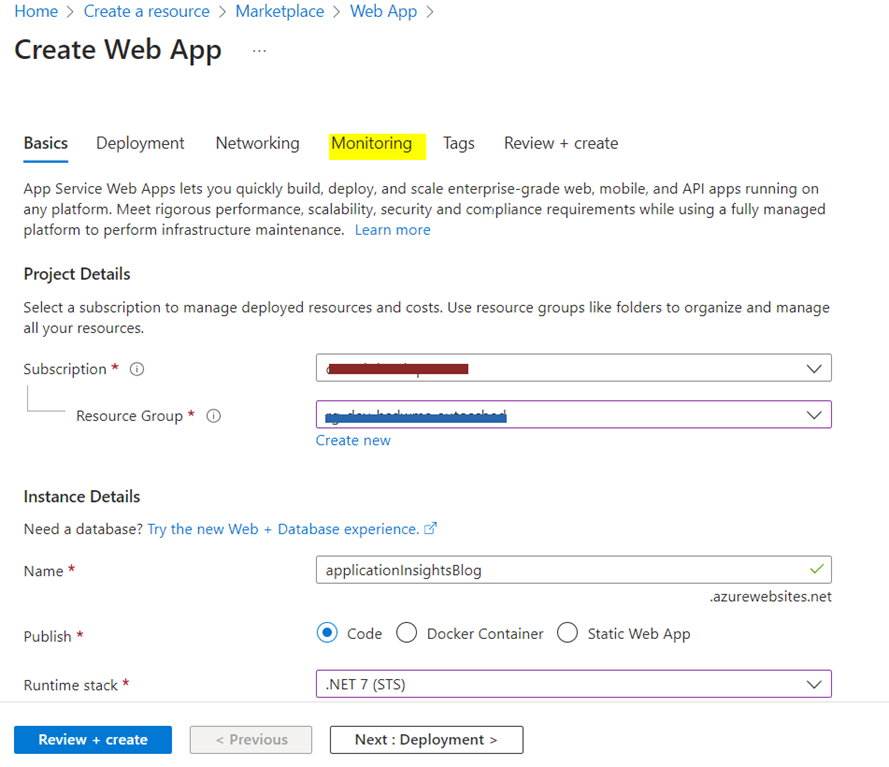
Step 7: Under the Monitoring tab if you have existing Application Insights use that one or create a new one.
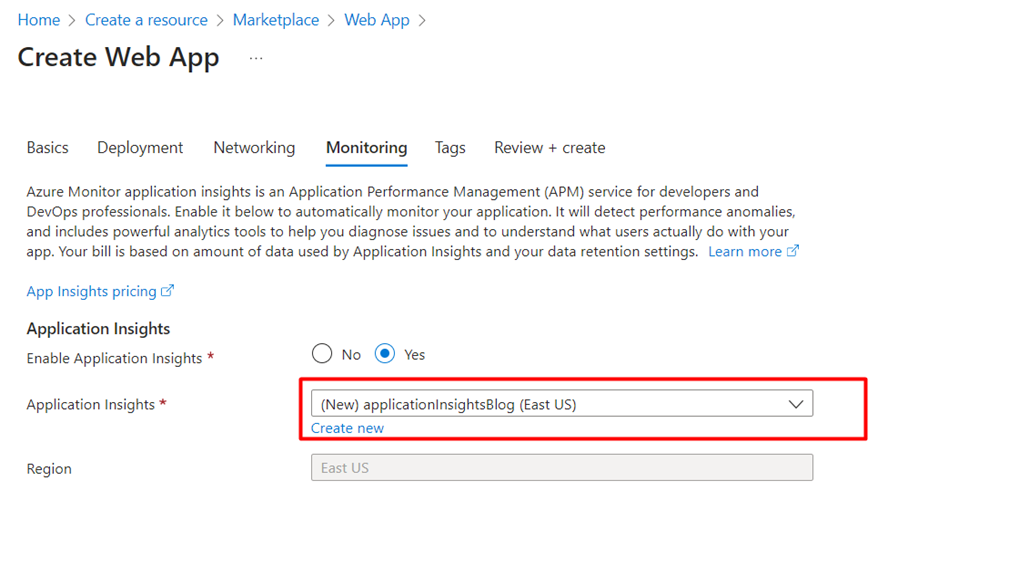
Step 8: After this review and creation of the app service, the application hosted under this app service will be monitored.
After this, we need to integrate Application Insights in the Angular application and the .NET API application and make sure we use the same Application Insights resource in both the app services to capture the insight together.
To get the instrumentation key, navigate to the respective Application Insights --> Overview, and you can find it in the top left corner.

Configure the Application Insights in the .NET Application
In your .NET API project, you need to install the Application Insights SDK. You can do this by adding the appropriate NuGet package to your project. For example, you can use the Microsoft.ApplicationInsights.AspNetCore package for ASP.NET Core applications.
Then, add the below code into the Program.cs

If in case you need to track the requests from localhost, then pass the instrumentation key as a string or add it in appsetting.json and pass it as a configuration parameter to the same method.

Configure the Application Insights in the Angular Application
- Copy the instrumentation key into the Angular application. If your app was built using the Angular CLI, then you will have an environment.ts file, which is a good place to store the instrumentation key. You may choose another file or service, but this key must be included in your project somewhere.

We need to install the following NPM package.

We need to create a type script class to handle the Application Insights logic.
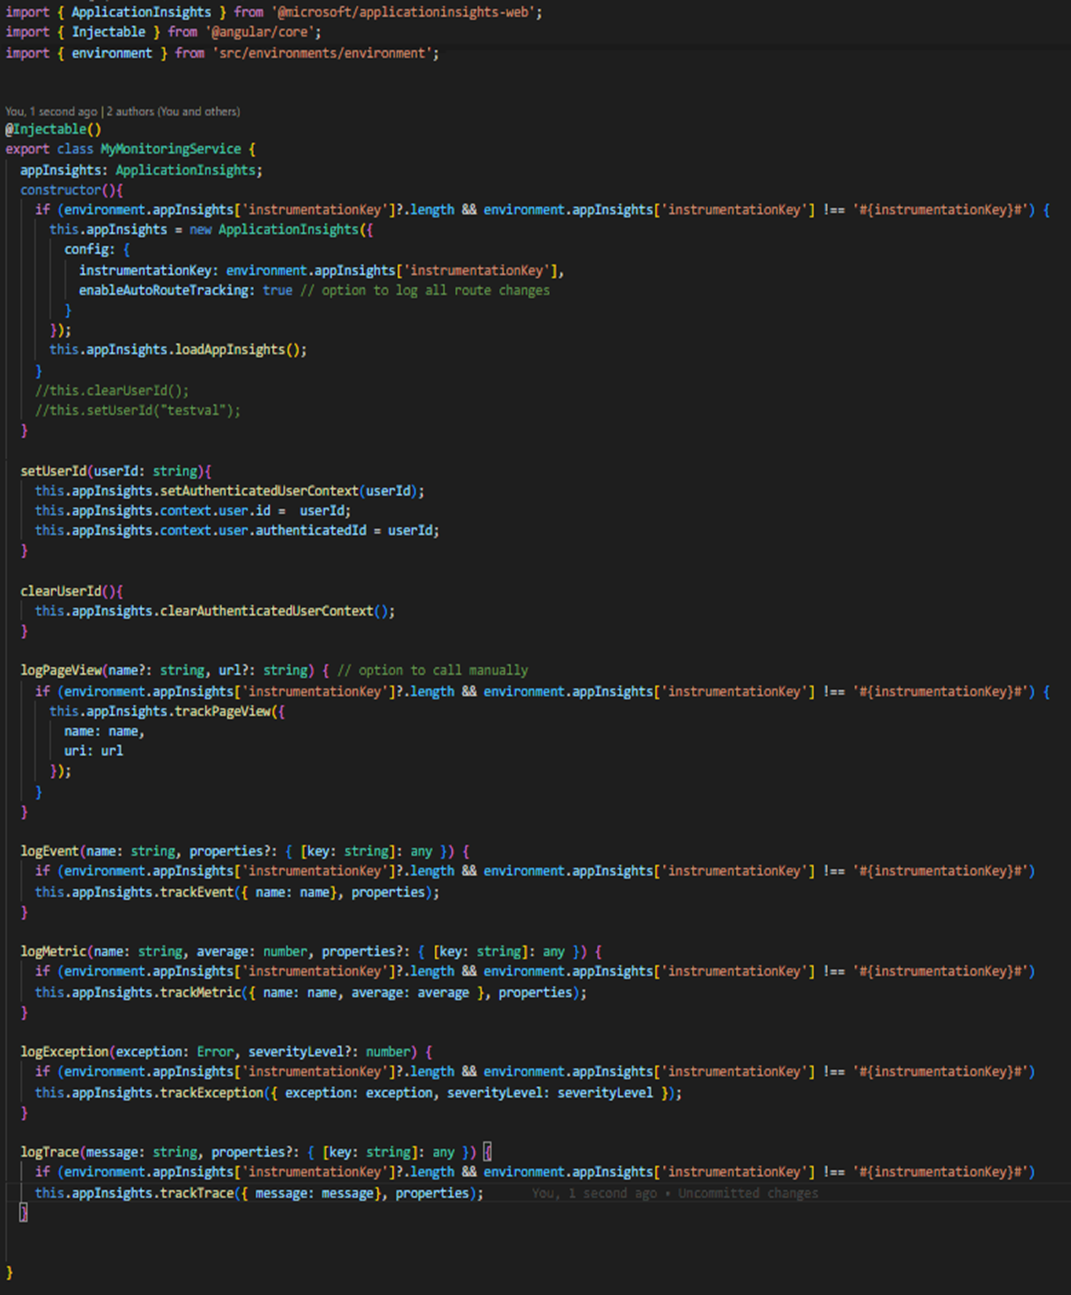
Add a custom error handler.

In the NGmodule, we need to create a provider for the error handler.

Explicitly, we can log the event on button clicks.

Features of Application Insights
Application Tracking in Azure Application Insights

Under the overview section, we can start seeing the tiles which track different parameters.
Investigate Application Map
Application Map in Azure Application Insights provides a visual representation of the components and dependencies within your application ecosystem. It helps you understand the architecture, track dependencies, analyze performance, and troubleshoot issues efficiently. The map offers a comprehensive view of how different services and resources interact, enabling you to optimize your application's performance and enhance user experience.

The above picture shows the flow between the dependent components, and we can notice that one of the flows is red, indicating a failure in the flow. On clicking the flow, the request and response details between the two components are revealed.

We can navigate to investigate failures or performance from here or from the Investigate tab under Application Insights.
Live Metrics
Live Metrics is a feature of Azure Application Insights that provides real-time monitoring and visualization of key metrics and telemetry data from your application. It allows you to observe the behavior and performance of your application in real time, so you can quickly identify issues, anomalies, and trends. In this blog post, we will explore the concept of Live Metrics and its significance in monitoring and troubleshooting applications.

Failures
Failures under Azure Application Insights refer to errors, exceptions, and issues that occur within your application and are captured by the monitoring and diagnostics service. Here are some key aspects related to handling failures under Azure Application Insights.

We can also navigate to the next tab which is Dependencies to see which of the dependence calls have failed.

Clicking the response codes allows us to see the complete details. Similarly, we can navigate to the Exceptions tab to monitor the exceptions that occurred in the application.

We can navigate to End-to-end Transaction by clicking the right arrow to see the Stack Trace and Exception properties.

Auto-Recovery Integration
Based on these Insight types we can use other Azure resources to handle errors.
- Sometimes, if there is any critical error type it must be immediately addressed. Then, we can configure some notification system to trigger the email to the respective team/person.
- Sometimes, the service is unavailable, and during such failures, we can set up a runbook and link it to an alert to start the resource/service.
- Also, we can trigger the logic or function app to execute a custom script to fix the error.
- When an instance is unavailable, the system can be configured to redirect to the available instance of the resource.
These are only some of the Application Insights features. Many more options too are available.
Case Study
Introduction to Application
The Azure cloud-based web application automates work scheduling for Electric Operations clients. The focus of the application developed was to ease the work of assigning manager jobs. This application identifies the work and availability of the workers and lists all the work assignment suggestions against each work. Once the suggestion list is listed, work assigning managers can review the work assignment, permits, and approve the crew assignment.
Block Diagram
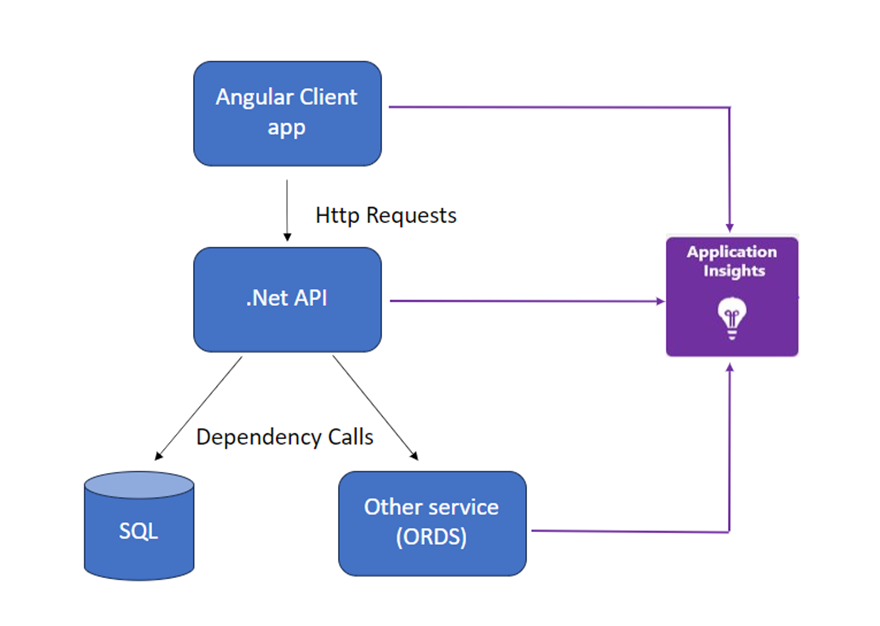
Challenges Before Application Insights
- As this was a new system, the client had the task of identifying various work-assigning managers using the application for a certain duration and to track the events used.
- This application integrated with ORDS, the client's main API system, to read data from a single source of truth. Sometimes, the application received bad requests from ORDS, and we failed to see results on the UI. The first thing was to investigate what was wrong in the path and parameters. Without debugging, it was difficult to understand the issue. Debugging was not an option in the deployed environment.
- One of the intermittent timeout issues in the deployed environment was where the table on the angular application was taking a long time to load, as our .NET API needed to fetch data from our SQL database and from the ORDS system, which was causing the APIM time out issue.
Now, let's see how Application Insights helped us with easy troubleshooting and monitoring of this enterprise application.
Use of Application Insights to Overcome the Challenge
Tracking the User Activities in our Application
One of the challenges the client management faced was tracking the number of users in the newly hosted application and finding out how many work-assigning managers were assigning the work.
So, we logged the events based on clicks and this has helped track the number of users during the specified duration.


Capturing the Call Details
One more challenge for the systems that are integrated with external applications is to dynamically create API calls. Often, there is a need to investigate bad request responses. Using Application Insights, it is easy to just navigate to Failed request -> End-to-End transaction details. Here, we can see the dynamic URL formed and easily investigate the parameters.
API Performance
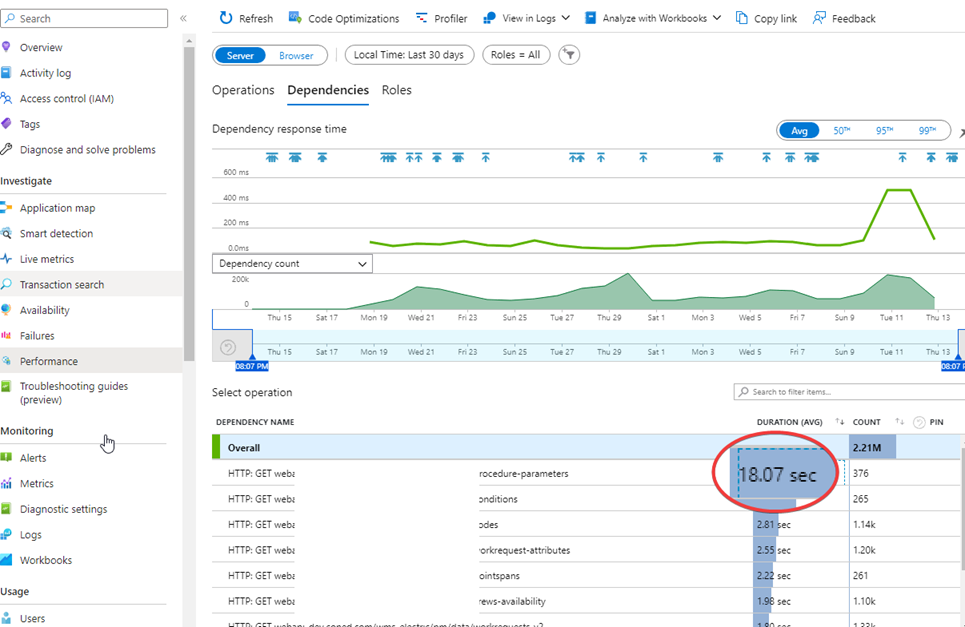
One common issue in all API development is performance. We too encountered this problem with one of the tables frequently failing to display data in the hosted environment due to the time-out limit configured in APIM. During our initial investigations, we discovered that the API was taking time from the network tab. However, the challenge was to identify which one among the dependencies (refer to block diagram) was taking time.
With Application Insights, it was possible to track calls by navigating to the Performance tab, choosing the call related to loading the table, and then navigating to dependencies. The highest time-taking dependency was displayed right there, and further action was required to decrease the time.
Conclusion
Application Insights is one of the extensions available in Azure Monitoring Service. Azure Monitor is a comprehensive monitoring solution for collecting, analyzing, and responding to data from cloud and on-premises environments. The Azure Monitor collects and aggregates data from every layer and stores it in the form of logs, traces, metrics, etc. This stored information can be consumed by many other extensions like workbooks, dashboards, and log analytics. One such extension is Azure Application Insights, the focus of this blog.
We have seen some of the important use cases of Application Insights. There are many more interesting options available under Azure Application Insights that can make developers and application owners' work easy, like alerts, showcasing live graphs in business meetings, using KQL (Kusto Query Language) to explore our data and discovering patterns, identify anomalies, etc. in advanced level use-cases.
Author Bio
- Name: Nagasharath D R
- Position At Encora: Senior Software Engineer
- Education: B.E in Computer Science
- Experience: 7y 6 months
- LinkedIn Profile: https://www.linkedin.com/in/nagasharath-d-r
About Encora
Fast-growing tech companies partner with Encora to outsource product development and drive growth. Contact us to learn more about our software engineering capabilities.
